SpectroWeb 2.0 Status January 2026
SpectroWeb 2.0
SpectroWeb 1.0 will soon be superseded with ... SpectroWeb 2.0.
A complete revision of the user interface is in preparation with
new interactive functionalities. The standard spectra and atomic
lines database will be updated to the BRASS development status
at http://brass.sdf.org
Coming soon. Stay tuned.
Alex Lobel, Nov 2025
SpectroWeb Status Jan 2018
SpectroWeb Rationale
SpectroWeb was developed to provide the astronomical community with publicly available interactive digital spectral atlases of bright stars for the identification of spectral features used in a wide range of scientific and instrumental applications. The demand for publicly available standard spectral atlases is steadily increasing with the fast improvements in spectral wavelength resolution and the quality by which bright stars of nearly all spectral types are being observed with modern spectrographs. Printed atlases of stellar spectra often only provide a small list of identified features without an assessment of the reliability of the spectral line identifications. Users often have no means of telling whether or not the spectral line identifications are valid, or if they have been revised since publication. On the other hand, many public databases with spectral line information (that can be text queried on-line), are based on theoretical calculations that have not been tested, or are difficult to test against observed stellar spectra. Users often cannot verify if the provided line lists apply to their spectroscopic observations. The spectral line information can contain identifications that do not apply to an observed stellar spectrum because of unknown atmospheric formation conditions or elemental abundance differences with the solar values. Conversely, observed spectral features can often not be identified because the quality of the provided atomic and molecular line data is limited and requires further improvements.
SpectroWeb has been developed to provide users with a means to
directly assess the quality of spectral line identifications by comparing
high-quality observed spectra of bright stars with state-of-the-art computed
spectra through an interactive on-line application.
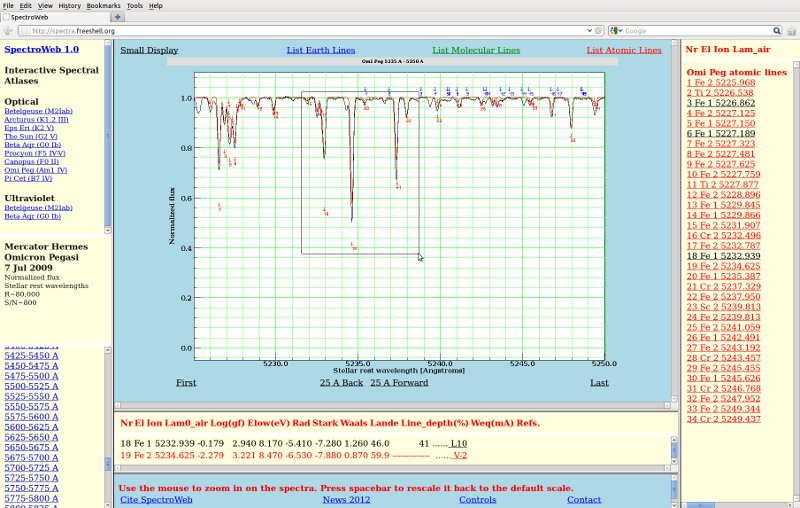
The program currently allows users to select 10 and 25 Å spectral regions of
interest from an interactive list of observed wavelengths. The continuum
normalized observed and computed spectra are overplotted and marked with
spectral line identifications when the central flux of the lines differs
by more than two percent from the flux level of the stellar continuum. The
user can further enlarge (zoom in) the displayed spectral regions by selecting
smaller regions of interest by pressing and releasing the left mouse button.
Atomic, molecular, and Earth spectral line identifications in the region of
interest can be selected and listed in an interactive table to the right of
the displayed spectrum. Each identified line can then be selected from
the table to list corresponding detailed atomic and molecular information.
View a SpectroWeb screenshot.
SpectroWeb Software and Releases
SpectroWeb 1.0 is based in part on graphical software packages written nearly a decade ago by Leigh Brookshaw of the Univ. of Southern Queensland, Australia [1]. The Java software packages are written to allow dynamic linking across the Web through an "applet" that loads in any Internet browser for which the Java interpreter has been activated. Java is an object-oriented programming language that has much in common with the C++ programming language.
The SpectroWeb 1.0 interface contains a number of features and improvements over the original graphical Java software with the goal of displaying high-resolution stellar spectra. The software is embedded in Hyper-Text (HTML) language driver programs to facilitate an interactive display of selected spectral regions and for linking an extensive on-line database of related line identifications. The SpectroWeb precompiled Java class files are free for distribution. With it users can provide high-resolution digital spectral atlases and line data online through a fast and user-friendly interactive display.
The SpectroWeb 1.0 database is under permanent development. The team of developers
invites everyone who wants to contribute in an effort to further improve
the user interaction with SpectroWeb. SpectroWeb 1.0 and an initial spectral
line database are currently served online through the Super Dimension
Fortress Public Unix webhost in Dallas.
http://spectra.freeshell.org/spectroweb.html
More stars, wavelength regions, and spectral line data will be added to the
stellar spectral atlases as time and more disk space become available.
The ultimate goal of SpectroWeb is to link and read various stellar atlases
in one database that is served from different public websites allover the
world using a standardized and commonly approved fast interactive display.
New updates and of SpectroWeb 1.0 occur on a regular basis through
the SDF Public Webserver.
SpectroWeb 1.0 Observed and Computed High Resolution Solar and Stellar Spectra
The SpectroWeb 1.0 database currently includes a number of observed high-resolution optical spectra of the Sun and bright stars. The high-resolution spectra are observed with very large S/N ratios in on-going observing programs, e. g. with Mercator-Hermes at La Palma. The VLT-UVES spectra are publicly available through the ESO Archive [3] . The spectra have been observed with wavelength resolutions of R~350,000 (KPNO FTS Solar atlas), R~80,000 (VLT-UVES and Mercator-Hermes). They have been converted to the solar and stellar rest wavelength scales to facilitate an accurate comparison with computed spectra (and wavelengths observed in vacuum above 2000 Å are converted to air wavelengths.) The observed fluxes have been continuum normalized for this purpose.
The spectra in SpectroWeb 1.0 are currently computed using a grid of Kurucz
stellar atmosphere models that are available online from
[4] , and [5].
The list of atomic lines for metals to compute the spectra in LTE
is available online from [6]
and [7] . Some diatomic molecules have
been included to improve the computed position of the stellar continuum level.
Note that the computed spectra exclude telluric lines due
to water vapor and and O2 in Earth's atmosphere. The strongest H2O and O2
lines are marked in blue color in the observed spectra.
It is also important to note that
the computed spectra are convolved with a Gaussian filter to simulate
the instrumental profile for the observed spectra. Many spectral lines
therefore blend together in the computed spectra, which can sometimes be
determined from asymmetries in observed spectral features. Users should
be cautious that current linelists to compute the spectra are incomplete
and many observed spectral features (usually weak absorption lines)
require further improvements of the atomic information or have yet to be
identified.
SpectroWeb 1.0 Atomic Data and Line Markers
SpectroWeb 1.0 displays numbers (marked with a small arrow) in the observed (solid drawn black line) and computed spectra (solid red line). They are helpful to identify absorption lines and features in the spectra. The markers for atomic lines and corresponding atomic data listed below the spectra are obtained from the Vienna Atomic Line Database [8] . Please note that the theoretical spectra in SpectroWeb are NOT computed with log(gf)-values provided in VALD. The VALD line lists are currently used for marking in the plotted spectra atomic lines useful for the identification of the spectral absorption features.
The line rest wavelengths and log(gf)-values for computing
the theoretical spectra in SpectroWeb are permanently updated
and further improved. The log(gf)-values of 1178 optical atomic
absorption lines in SpectroWeb have been updated with
best fits to the observed spectrum of the Sun, Eps Eri, and Procyon.
These lines are labeled with L07. Atomic lines labeled in black
with L10 list validated atomic data. The computed normalized
depths of the validated lines are within 3 % of the normalized
line depths observed in these stars. SpectroWeb also lists the
computed equivalent line widths for the log(gf)-values of the
validated lines, together with the atomic line data we use in the
detailed spectral synthesis calculations. The atomic data of all
other lines labeled with V-2 are non-validated and have yet to be
confirmed with detailed spectral synthesis calculations that correctly
fit the observed spectra in SpectroWeb.
SpectroWeb 1.0 to do list October 2010
Further research work is in progress for compiling much more extensive lists
in SpectroWeb with empirically validated log(gf)-values (besides the lines
currently marked with L07 and L10) based on detailed spectral synthesis calculations
of various stars. We are also searching for a high-quality optical spectrum
of Canopus to evaluate the log(gf)-values for many more lines of ionic
species.
References with Weblinks
[1] Brookshaw, L. 1996, "Java 2D Graph Package, Version 2.4",
[2] Russell, J. P., 2001, "Java Programming for the absolute beginner", Prima
Publishing, Roseville, CA
[3] Bagnulo, S., Jehin, E., Ledoux, C., Cabanac, R., Melo, C., Gilmozzi, R.,
and the ESO Paranal Science Operations Team, 2003, Messenger, 114, 10
http://www.sc.eso.org/santiago/uvespop
[4] Kurucz, R. L. 1993, "ATLAS9 Stellar Atmosphere Programs and 2 km/s grid",
Kurucz CD-ROM No. 13, Cambridge, Mass.
[5] Kurucz, R. L. 1994, "Solar Abundance Model Atmospheres for 1, 2, 4, 8
km/s",
Kurucz CD-ROM No. 13, Cambridge, Mass.
http://kurucz.harvard.edu/grids.html
[6] Kurucz, R. L., and Bell, B., 1995, Kurucz CD-ROM No. 23, Cambridge Mass.
http://kurucz.harvard.edu/linelists.html
[7] Smith, P. L., Heise, C., Esmond, J. R., and Kurucz, R. L. 1996, "On-Line Atomic
and Molecular Data for Astronomy", in UV and X-ray Spectroscopy of Astrophysical
and Laboratory Plasmas, K. Yamashita and T. Watanabe, eds., Universal Academy
Press, Tokyo, 513
http://www.pmp.uni-hannover.de/cgi-bin/ssi/test/kurucz/sekur.html
[8] Kupka, F., Piskunov, N. E., Ryabchikova, T. A., Stemples, H. C., Weiss,
W. W. 1999, A&AS 139, 119
http://www.astro.uu.se/~vald/php/vald.php
http://vald.astro.univie.ac.at/~vald/php/vald.php
http://vald.inasan.ru/~vald/php/vald.php